


A successful business intelligence project is far more than a tech upgrade. It's a strategic weapon that turns raw data into tangible business results, whether that’s boosting revenue, cutting customer churn, or making your operations ruthlessly efficient. In my decades of driving growth across SaaS, marketplaces, and real estate, I've learned one hard lesson: the secret isn't in the software; it's in making sure your data strategy is perfectly aligned with your core business goals from day one.
Aligning BI Implementation with Business Growth

I’ve seen it happen more times than I can count. A company gets excited about a new BI initiative, spends a fortune, and a year later, the project is dead in the water. It’s almost never the technology’s fault. The real problem? A complete lack of strategic alignment right from the start.
It's easy to get dazzled by the promise of sleek dashboards and endless charts. Too many leaders make the mistake of jumping straight into vendor demos without first answering the single most important question: "What business problem are we actually trying to solve?"
Think of a BI initiative as a growth project, not an IT project. Its success depends entirely on whether it can move the needle on key metrics like EBITDA, market share, or customer lifetime value. Before you even glance at a piece of software, you need to lay this strategic groundwork.
Uncovering the Critical Business Questions
The real work begins with people, not platforms. My first move on any business intelligence implementation is to get out of the boardroom and talk to the people on the front lines. I schedule one-on-one interviews with the heads of sales, marketing, operations, and finance.
But I don't ask them what data they want. I ask about their biggest headaches and their most ambitious goals.
- To the Head of Sales: "If you could answer one question right now, what would it be to help your team close deals 10% faster?"
- To the Head of Marketing: "What’s the one blind spot you have that, if illuminated, would help you slash your customer acquisition costs?"
- To the Head of Operations: "Where are the hidden bottlenecks in our supply chain that we just can't seem to find?"
These conversations are gold. They reveal the burning questions that directly impact business performance. The answers become the foundation of your BI strategy, guaranteeing that every dashboard you build is tethered to a real-world, critical business need.
The goal isn't to measure everything. It's to measure what matters. A great BI system delivers clarity, not more complexity. It answers the questions that lead to smarter, faster decisions—the kind that actually affect the bottom line.
Defining Success in Tangible Terms
Once you’ve nailed down the key business questions, the next step is to translate them into specific, measurable outcomes. Vague goals like "improve efficiency" are a setup for failure. You need to be ruthlessly specific.
Don't aim for "better marketing insights." Instead, set a goal to "cut marketing spend on underperforming channels by 20% within six months." Forget "understanding our customers." Your objective should be to "identify at-risk customer segments and launch a retention campaign to lower churn by 15% in the next two quarters."
This level of precision does two crucial things:
- It gives your data and analytics teams a crystal-clear roadmap.
- It establishes a concrete benchmark for measuring the ROI of your BI investment.
There’s a reason this market is exploding. By 2026, the global business intelligence and analytics market is expected to hit roughly $84.6 billion. We also know that organizations with high BI adoption are five times more likely to make faster, better-informed decisions. You can find more insights about business intelligence statistics to see just how much this field is growing.
Getting this foundational phase right is more than half the battle. It turns a business intelligence implementation from a pricey tech experiment into a powerful engine for growth, ensuring every dollar and hour invested is directly tied to creating real, measurable value.
Building Your Data Infrastructure and Governance

Let's be direct: your BI initiative is only as good as the data it sits on. We’ve defined the strategic goals, but now we get into the heavy lifting. This is where we build the engine that will power every single insight and decision.
I’ve seen promising projects completely derailed by a flawed data foundation. It’s the classic ‘garbage in, garbage out’ syndrome, and it’s entirely avoidable if you're disciplined from day one. You can't build a skyscraper on quicksand, and you can't build a growth-driving BI system on chaotic, untrustworthy data.
This stage is non-negotiable. It’s all about creating a single source of truth that the entire organization—from the C-suite to the front lines—can rely on without hesitation.
Conducting a Comprehensive Data Audit
Before you can integrate anything, you need a clear map of your current data landscape. This always starts with a comprehensive data audit. The goal here is to find and catalog every single data source that fuels your business.
And you need to think beyond the obvious. Your primary systems like Salesforce (CRM) and NetSuite (ERP) are critical, of course, but the real gems are often locked away in less obvious places. I'm talking about the data from your marketing automation platform, your customer support ticketing system, and even the unstructured feedback buried in sales call logs.
During the audit, your team should focus on a few key questions for each data source:
- Relevance: How directly does this data relate to the business questions we identified earlier?
- Quality: Is the data accurate, complete, and consistent? Are there glaring gaps or constant errors?
- Accessibility: How hard is it to actually get this data out? Does it require a specialized team or custom scripts?
- Ownership: Who is responsible for this data? If something is wrong, who do we call?
This process isn't just about making a list. It's a diagnostic tool. It reveals your most valuable assets and your most significant liabilities. This is how you find out that your sales team uses a different customer ID system than your finance department—a silo that's been costing you countless hours in manual reconciliation.
Creating a Single Source of Truth
With your audit complete, the next objective is data integration. This is where we break down the walls between departments. The whole point is to create a unified data model where information flows seamlessly between your CRM, ERP, marketing platforms, and other key systems.
This usually involves setting up a centralized data warehouse, maybe something like Amazon Redshift or Google BigQuery. Think of this as the central library where all your cleaned and structured data lives. An ETL (Extract, Transform, Load) process is the pipeline that pulls raw data from its source, cleanses and standardizes it, and then loads it into that warehouse.
For example, a customer's journey might start in Marketo, move to Salesforce when they become a lead, and then to your billing system upon purchase. Without integration, you have three separate, incomplete pictures. By unifying this data, you get a 360-degree view of the customer, allowing you to accurately calculate lifetime value and predict churn.
A successful business intelligence implementation doesn't just present data; it tells a coherent story. That story is impossible to read when every chapter is written in a different language and stored in a different library. Integration is the act of translation and consolidation.
Establishing a Robust Governance Framework
Finally, you have to establish a data governance framework right from the start. This isn't just about IT policies or checking a compliance box. It's about building trust and accountability across the entire organization.
A strong governance framework clearly defines a few key things:
- Data Ownership: Assign specific people or teams as stewards for key data domains (e.g., the sales team owns customer contact data).
- Data Quality Standards: Create clear rules for data entry and maintenance to ensure everything stays consistent and accurate.
- Access Protocols: Define who can view, edit, and analyze specific datasets. This protects sensitive information while still empowering users with the data they need to do their jobs.
- Data Dictionary: A living document that defines every metric and field. When someone sees "ARR" in a report, they know exactly how it's calculated, leaving no room for misinterpretation.
Putting this framework in place is what prevents your shiny new data warehouse from turning into a data swamp. It ensures that as your business grows and your data volume explodes, the quality and trustworthiness of your insights remain high. This is the foundation that makes every other step of your BI journey possible.
Choosing the Right BI Tools for Your Teams
The market is flooded with business intelligence tools, and every vendor will tell you their platform is the silver bullet for your data problems. I’ve sat through enough sales demos to know they’re designed to dazzle you with flashy features and complex visualizations. But here's a hard-earned lesson from my experience: the flashiest tool is rarely the right one.
Your goal isn’t to buy the most powerful platform; it’s to find the one your teams will actually use every single day. A successful business intelligence implementation lives and dies by user adoption, not just technical specs. The moment a tool becomes another frustrating bottleneck requiring IT support, you've already lost the battle.
We need to shift the question from, "What can this tool do?" to "How will this tool fit our business and empower our people?" This simple change in perspective helps you invest in a solution that delivers real-world value, not just an expensive piece of shelfware.
A Pragmatic Scorecard for Vendor Evaluation
To cut through the marketing noise and get to what matters, I always rely on a simple but effective scorecard. This isn't about just ticking boxes on a feature list. It’s about methodically evaluating potential vendors against the criteria that will actually impact your long-term success.
We build a framework to score each potential tool on a scale of one to five across a few key areas. This forces a disciplined, objective comparison and takes emotion out of the decision.
Here are the non-negotiables I insist on including in any evaluation:
- Ease of Use for Non-Technical Users: Can a marketing manager or sales lead build a basic report without writing code or logging an IT ticket? If the answer is no, adoption will be a constant uphill struggle.
- Integration Capabilities: How well does it play with your existing tech stack? You need seamless connections to your CRM, ERP, and marketing platforms. A tool that creates more data silos is a step backward, not forward.
- Total Cost of Ownership (TCO): Look beyond the sticker price. You have to factor in implementation, training, ongoing maintenance, and future upgrade costs. A tool with a low initial license fee can quickly become a money pit if it requires endless consulting hours.
- Scalability and Performance: Will this tool grow with you? It needs to handle more data and more users six months from now without grinding to a halt.
The entire industry is moving toward user empowerment, which is fueling massive growth. The self-service BI market is projected to skyrocket from $6.73 billion in 2024 to $27.32 billion by 2032. This trend highlights the huge demand for tools that get data into the hands of employees, allowing them to find their own answers. You can read more about self-service business intelligence trends and see just how this shift is reshaping the industry.
To put this into practice, I use a scorecard to compare the top contenders side-by-side. It makes the strengths and weaknesses of each option crystal clear.
BI Tool Selection Scorecard
| Evaluation Criterion | Tool A Score (1-5) | Tool B Score (1-5) | Tool C Score (1-5) | Notes/Justification |
|---|---|---|---|---|
| Ease of Use (Non-Technical) | 5 | 3 | 4 | Tool A has a true drag-and-drop interface. Tool B required some SQL knowledge for custom reports. |
| Integration with Salesforce/NetSuite | 4 | 5 | 3 | Tool B has native connectors, which is a huge plus. Tool C would require a custom integration. |
| Total Cost of Ownership (TCO) | 3 | 4 | 5 | Tool C is the cheapest upfront, but Tool B's lack of consulting needs makes its TCO very competitive. |
| Scalability & Performance | 4 | 5 | 3 | Tool B is built for enterprise-level data volumes. We're concerned Tool C might slow down in a year. |
| Vendor Support & Training | 4 | 4 | 2 | Tools A and B have strong documentation and responsive support. Tool C's support is community-based. |
This kind of objective analysis is crucial. It moves the conversation beyond slick demos and grounds the decision in what your business actually needs to succeed.
The Power of the Pilot Program
A scorecard is a fantastic starting point, but you can't truly know how a tool will perform based on a demo. The single most critical step in this whole process is running a pilot program with real users.
And I don't just mean giving it to a few data analysts. You need to put the top two or three contenders into the hands of the people who will be using them to make daily decisions.
Get firsthand feedback from a cross-section of your organization. Pick a few users from sales, marketing, and operations. Give them a real business problem to solve with the tool. Their experience—their frustrations and their "aha!" moments—is worth more than any sales pitch you'll ever hear.
This approach gives you a clear picture of how a tool will actually perform in your environment, impacting metrics like adoption and decision-making speed.
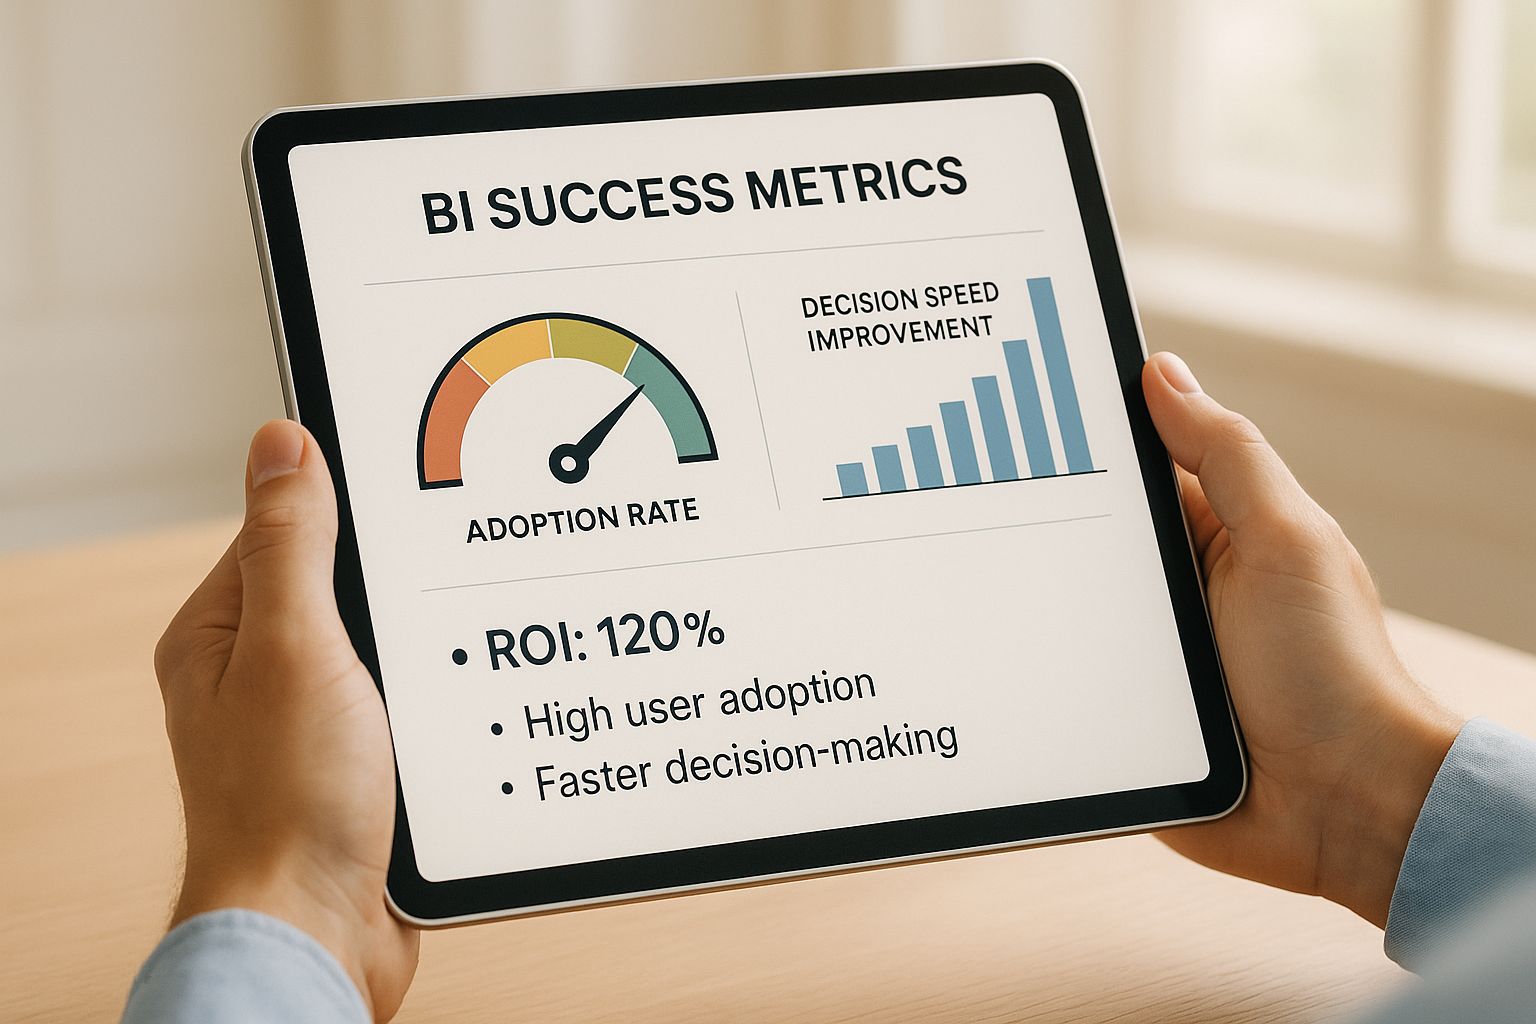
As you can see, high adoption has a direct line to faster, smarter decisions, which is what ultimately drives your ROI. The feedback from your pilot program tells you exactly which tool will get you there. It replaces guesswork with direct evidence, ensuring your final choice is one that truly empowers your teams from day one.
Driving Adoption and Fostering a Data Culture
Let's be brutally honest for a moment. You can nail the technical side of a business intelligence implementation, build a pristine data warehouse, and pick the perfect tool, but if your teams don't actually use it, you’ve just built a multimillion-dollar monument to failure. This is where your strategy has to meet human psychology, and it's tragically the most overlooked part of the process.
A beautiful BI platform that nobody ever logs into is just expensive shelfware. The final, and arguably most critical, phase is all about weaving data into the daily heartbeat of your company. The goal is to transform it from a "special project" into the default way people make decisions.
This isn't something you can achieve with a single company-wide email. It requires a deliberate, thoughtful campaign to win over hearts and minds, one team at a time.
Identify and Empower Your BI Champions
In every company, you'll find people who are naturally curious and data-savvy. They're the ones already living in spreadsheets, hungry for better tools to answer their questions. These individuals are your future BI Champions, and they are your single most valuable asset for driving adoption.
My first move is always to find these power users within each department—sales, marketing, finance, you name it. They aren't always managers; often, they're the on-the-ground experts that their colleagues already trust for answers.
Once you’ve found them, you need to empower them:
- Give them early access. Let them get their hands dirty and play with the platform before anyone else. Their genuine excitement will be contagious.
- Provide advanced training. Go deep with them. Make sure they understand the tool's full capabilities so they can become the first line of support for their peers.
- Turn them into evangelists. Involve them in launch presentations and training sessions. A recommendation from a trusted colleague is infinitely more persuasive than a directive from an executive.
These champions become a grassroots force, translating the value of BI into the specific language and real-world context of their own teams.
Tailor Training to Your People
A one-size-fits-all training program is a guaranteed recipe for disengagement. An executive staring at a screen full of SQL queries will tune out in seconds, just as a data analyst will be bored stiff by a high-level overview. You have to design a tiered training program built around different user personas.
My playbook for this usually involves three distinct tracks:
- The Executive Track: This is a quick, 30-minute session focused on high-level dashboards and mobile access. We cover how to find the top-line KPIs they care about, how to filter by region or product line, and how to subscribe to automated reports.
- The Manager Track: This is for department heads and team leads. We cover their core dashboards but also dive into how to drill down into the data to answer common "why" questions and track their team's performance.
- The Analyst Track: This is the deep dive for your power users. Here, we get into advanced report building, data modeling concepts, and how to connect new data sources for ad-hoc analysis.
When you respect people's time and give them only what’s relevant to their role, you dramatically increase the odds that the training will actually stick.
A BI tool is only successful when it becomes invisible—when checking a dashboard is as routine as checking email. This happens not through a mandate, but by making the tool so useful and intuitive that people want to use it.
Launch, Celebrate, and Iterate
Your BI platform's official launch should feel like a product release, not a routine IT update. Build some excitement. Host a launch event (even a virtual one works) where you showcase the new capabilities. Most importantly, have your BI Champions demonstrate how they are already using it to solve real problems.
You have to celebrate early wins publicly. When the sales team uses a dashboard to find a high-value cross-sell opportunity and closes the deal, shout it from the rooftops. When marketing pinpoints an underperforming ad campaign and saves $20,000, make sure the entire company hears about it.
Success breeds success. These stories provide the social proof needed to win over the skeptics and create a pull effect where other teams start demanding access and training.
Finally, you must establish a feedback loop. A BI platform isn't a static object; it’s a living, breathing system. Create a dedicated channel—a Slack channel, a specific email alias, a ticketing system—where users can ask questions, report issues, and request new features or dashboards. This shows you're listening and ensures the platform continuously evolves to meet the real-world needs of your business.
Measuring ROI and Optimizing for Continued Growth
So, we’ve done the heavy lifting. We’ve aligned the strategy with the business, built a solid data foundation, picked the right tool, and got people to actually use it. But now comes the question that echoes from the boardroom to your own desk: "So what?"
A successful business intelligence implementation doesn't end at launch; it's where the real work begins. This is the moment we prove its value in cold, hard numbers and turn our shiny new BI platform into a perpetual growth engine.
Too many teams get lost in vanity metrics like "dashboard views" or "number of users logged in." Those are nice to know, but they don't pay the bills. The real measure of success is tying BI usage directly to the concrete business outcomes we defined way back in the first phase.
From Vanity Metrics to Verifiable Value
Calculating the true Return on Investment (ROI) of a BI project isn't just about tallying up software licenses and consultant fees. It's about measuring both the hard savings and the strategic advantages the platform unlocks.
This means we have to look past the surface-level metrics and focus on tangible business impact. The KPIs you track now must be the same ones you set out to improve from day one.
- Operational Efficiency: Did we slash the time it takes to generate monthly sales reports from three days to thirty minutes? That’s a direct saving in labor costs you can take to the bank.
- Cost Reduction: Did our marketing team use a new dashboard to spot and cut $50,000 in wasted ad spend last quarter? That’s a pure, direct impact on the bottom line.
- Revenue Growth: Did the sales team use their new customer analytics dashboard to boost cross-sell revenue by 8%? That’s quantifiable growth, plain and simple.
- Customer Retention: Did we hit our goal of lowering customer churn by 15% because we could finally identify at-risk accounts before they walked away? That’s a massive win for lifetime value.
A BI platform isn't a cost center; it's an investment in smarter decision-making. The real ROI isn't just about saving money. It's about the value of the opportunities you seized—and the costly mistakes you avoided—because you finally had clear, trustworthy data at your fingertips.
This approach completely reframes the conversation from, "How much did we spend on this BI tool?" to "How much value did our improved decision-making create?"
Establishing a Cycle of Continuous Optimization
The most dangerous thing you can do after a successful launch is to dust off your hands and call the project "done." The market doesn't stand still, and neither should your analytics. The true power of a mature business intelligence implementation comes from its ability to evolve and uncover the next big opportunity.
This is where you need a formal process for ongoing optimization. I always recommend creating a cross-functional BI steering committee that meets quarterly. This group, made up of your BI champions and key department heads, is responsible for reviewing performance, prioritizing new requests, and sniffing out new avenues for analysis.
This iterative loop ensures your BI platform stays deeply relevant to the shifting priorities of the business, preventing it from becoming a static, outdated relic.
Tapping into AI for Predictive Insights
To truly get ahead of the curve, we have to look beyond historical reporting and into the future. This is where Artificial Intelligence and machine learning become essential parts of your BI strategy. Instead of just asking, "What happened?" we can start asking, "What is likely to happen next?"
It’s not some far-off concept anymore. In recent surveys from 2024, a staggering 78% of organizations reported using AI in at least one business function—a huge jump from 55% just a year prior. This rapid adoption is a clear signal that AI is a core business tool, right now. You can dig into the details in the latest research about the state of AI from McKinsey.
By building AI capabilities into your BI platform, you can move from describing the past to predicting the future, unlocking immense value:
- Predictive Churn Models: Analyze customer behavior to flag accounts at high risk of churning before they even think about leaving.
- Demand Forecasting: Help your operations team optimize inventory by more accurately predicting future sales trends.
- Lead Scoring: Focus your sales team's precious time by identifying which leads are most likely to actually convert.
This final piece closes the loop. It turns your BI system from a simple reporting tool into a proactive, intelligent engine that not only measures past performance but actively shapes future growth.
Common Questions on BI Implementation
Over the years, I’ve been in the trenches for dozens of business intelligence projects. In boardrooms and kickoff meetings, the same questions always surface from executives and their teams. Let's tackle them head-on, based on what I’ve seen work—and what I've seen fall flat—in the real world.
These aren't textbook answers. They come from the practical reality of breaking down data silos, managing expectations, and making sure every dollar spent on BI actually moves the needle.
What Is the Most Common Reason a BI Implementation Fails?
It’s almost never the technology. In my experience across SaaS, real estate, and hospitality, the single biggest killer of a BI project is a disconnect from clear business goals. A company gets dazzled by a shiny new BI tool but completely fails to tie it to specific, measurable outcomes.
What happens next is predictable. They build elaborate dashboards that don’t answer the real questions the sales, marketing, or operations teams grapple with daily. Before you know it, users see the new system as just another login to remember—a chore, not a tool that makes their job easier or helps them win.
Without champions on the business side and a relentless focus on solving actual problems, even the most powerful BI platform will end up as expensive shelfware. It becomes a solution looking for a problem, and that’s a recipe for a swift, quiet death.
How Long Should a Typical BI Implementation Take?
This is the classic "how long is a piece of string?" question, but I can give you a practical framework. My advice is always to think in phases, not one giant project. You can get a foundational implementation up and running, focused on one or two high-impact areas like sales pipeline analytics or marketing campaign performance, and deliver real value within three to six months.
This quick-win approach is critical. It lets you demonstrate ROI fast, which builds momentum and makes it much easier to get buy-in for future phases. A full, enterprise-wide rollout that has to pull in complex data from a dozen different systems? That can easily take 12 to 18 months, sometimes longer.
The one thing to avoid at all costs is the "big bang" launch. Start small, prove the concept with a core group of users, get their feedback, and then iterate. You'll de-risk the entire project and ensure the platform you build is based on what people actually need, not what you thought they needed a year ago.
Should We Build Our BI Solution or Buy a Commercial Tool?
For over 95% of companies, buying an off-the-shelf BI tool is the only logical choice. I've seen teams venture down the "build" path, and it almost always becomes a black hole for time and money.
On the surface, building a custom solution looks like the ultimate way to get exactly what you want. But the hidden costs are enormous, and they pop up in a few key places:
- Development: The initial build is just the tip of the iceberg. The engineering resources required are massive.
- Maintenance: You are now on the hook for every single bug fix, security patch, and compatibility update—forever.
- Innovation: BI leaders like Power BI or Tableau have poured billions into R&D. They offer user-friendly interfaces and advanced AI features that are simply impossible for an in-house team to replicate.
Your competitive advantage comes from using data to outmaneuver the competition, not from becoming a software company. Pour your resources into the strategic business intelligence implementation of a proven tool that puts data in the hands of your people. Let the software experts build the software so you can focus on building your business.
At MGXGrowth, we don't just draft strategies; we roll up our sleeves and help you execute. We partner with executive teams to architect and implement BI solutions tied directly to revenue, EBITDA, and market share. Learn how we can build your data-driven growth engine.